How effective are the best analysts?

Fang and Yasuda (2012), from INSEAD (the European Institute for Business Administration) and the University of California, Davis, examined the predictive abilities of the All-American (AA) analysts selected by Institutional Investor magazine. They used recommendation data from the I/B/E/S Detailed History file from October 1993 to December 2009.

The annual election of AA analysts has been the most visible and influential way in which analysts have been evaluated. Each spring, Institutional Investor sends out hundreds of surveys to buy-side fund managers to vote for the best analysts by industry, and the results are announced in the October issues of the magazine. The outcome of this evaluation has been one of the most important drivers of analyst pay. Information on the most recent results can be found here.

They found that AA made buy and sell recommendations with up to seven percent higher annualized risk-adjusted returns than other analysts. This performance differential existed both before and after AAs were elected, was not explained by announcement effect, and was not significantly eroded by Reg FD. This suggested that the AA analysts were, indeed, more skillful as opposed to having either a greater reputation or greater access to privileged information.
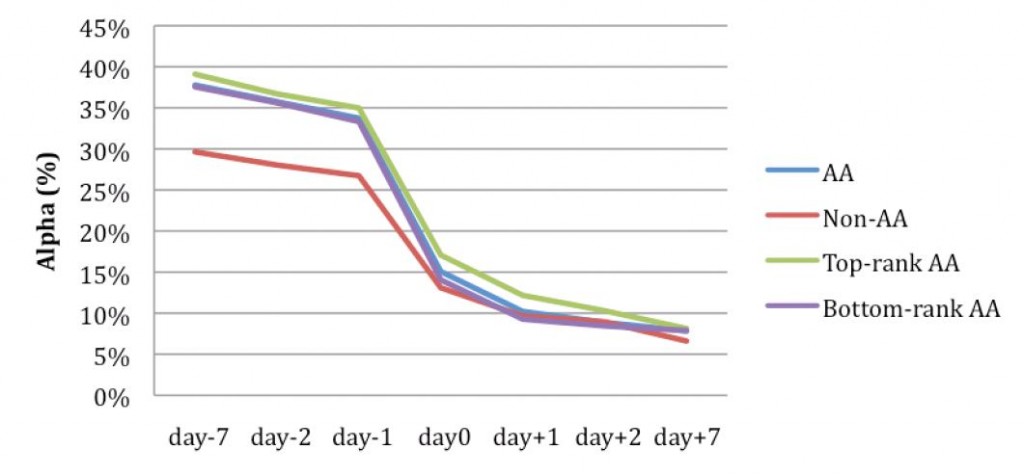
Risk-adjusted portfolio returns earned by hypothetically trading on AA and non-AA recommendations at various timings. The chart above shows buy recommendations. All alphas (i.e., returns beyond those of the market averages) are expressed as annualized returns in percentage points. Reprinted from Fang and Yasuda (2012) with permission.
Risk-adjusted portfolio returns earned by hypothetically trading on AA and non-AA recommendations at various timings. The chart above shows buy recommendations. All alphas (i.e., returns beyond those of the market averages) are expressed as annualized returns in percentage points. Reprinted from Fang and Yasuda (2012) with permission.

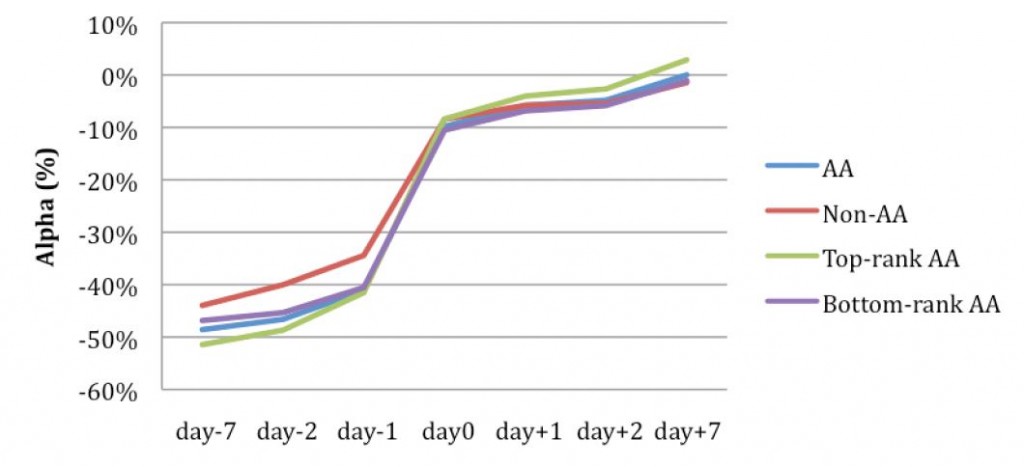
Risk-adjusted portfolio returns earned by hypothetically trading on AA and non-AA recommendations at various timings. The chart above shows sell recommendations. All alphas (i.e., returns beyond those of the market averages) are expressed as annualized returns in percentage points. Reprinted from Fang and Yasuda (2012) with permission.

Risk-adjusted portfolio returns earned by hypothetically trading on AA and non-AA recommendations at various timings. The chart above shows sell recommendations. All alphas (i.e., returns beyond those of the market averages) are expressed as annualized returns in percentage points. Reprinted from Fang and Yasuda (2012) with permission.


Profits from AAs’ recommendations diminished quickly with access delay. The study concluded that institutional investors were effective in evaluating analysts and that the AA status at least partially reflected real skill. While institutional investors have been well positioned to benefit from AAs’ views, other investors have had limited ability to do so. For investors without early access, the gain over other analysts was four percent per year and was confined to buy recommendations made by top-ranked AAs (analysts winning the first- and second-place titles for each industry). Thus, mass investors’ ability to “piggyback” on the AA title information about analysts was limited.

Trading strategy: Track the recommendations made by #1 and #2 ranked All-American analysts. Enter a trade, long or short, before the close of the day on which buy or sell recommendations are publicly announced. Hold the position for seven days. This strategy can be enhanced by also paying attention to the strength of the recommendation.

Posted in Book One: Forty Trading Strategies Based On Scientific Findings About Analysts' Forecasts Tagged with: , , , , , , , , , , , , , , , , , , , ,

What impact have recommendation rating levels had?

Barber, Lehavy, and Trueman (2010) – from the University of California, Davis, the University of Michigan, Ann Arbor, and the University of California, Los Angeles – examined the impact of the rating levels and changes in rating levels used by analysts. They analyzed all recommendations on the Zacks database from January 1986 through December 1995 and all real-time recommendations on the First Call database from January 1996 through the end of 2006.

Different analysts have used different rating level systems. In the most simple terms, they include strong buy, buy, hold, sell, and strong sell. However, the actual language varies a great deal. Nevertheless, for any given analyst, it is clear whether a revision is an upgrade or a downgrade. The research findings were consistent with what one would intuitively expect.

They found that the documented abnormal returns following analysts’ recommendations were derived from both the ratings levels and the ratings changes. Conditional on ratings level, upgrades earned the highest returns and downgrades the lowest. Conditional on the sign and magnitude of a ratings change, the more favorable the recommendation level, the higher was the return.

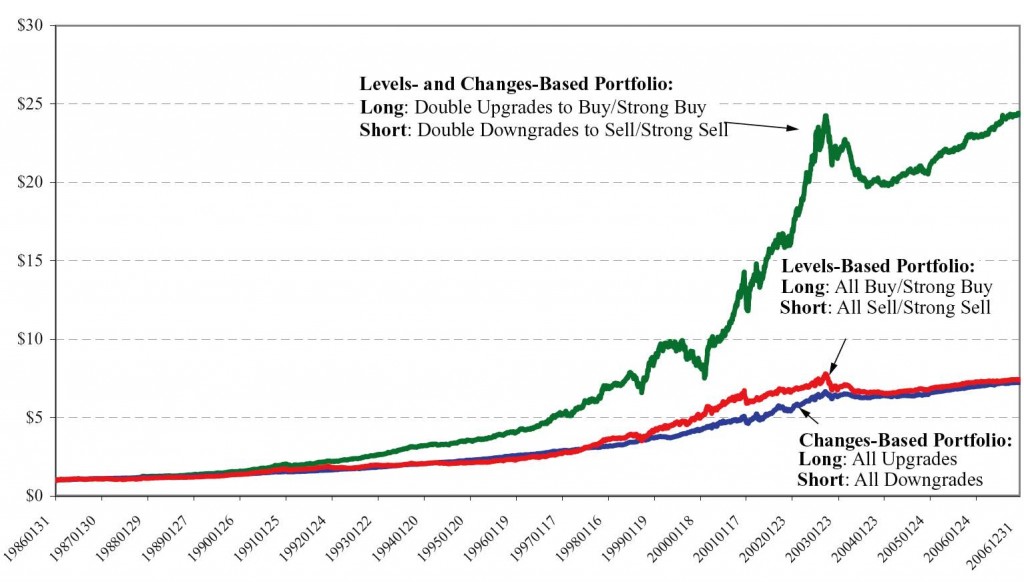
These results implied that an investment strategy based on both recommendation levels and recommendation changes had the potential to outperform one based on just one or the other. Conditioning just on recommendation levels, a strategy of buying all stocks rated buy or strong buy and shorting all those rated sell or strong sell, for example, would have earned an average daily abnormal return of 3.5 basis points during our sample period.

The stocks remained in the portfolio through the close of trading on the day that the brokerage firm removed the strong buy or sell rating (unless the recommendation removal was announced after trading hours, in which case the stock dropped out of the portfolio at the close on the next trading day).

Conditioning only on recommendation changes, a strategy of buying all stocks receiving a double upgrade and shorting all those receiving a double downgrade would have generated an average daily abnormal return of 3.8 basis points. However, conditioning on both ratings changes and levels by buying all stocks receiving a double upgrade to buy or strong buy and shorting all those receiving a double downgrade to sell or strong sell would have yielded an average daily abnormal return of 5.2 basis points. This is a greater than 4% improvement (on an annual basis) over the levels-only based strategy and a 3.5% annual improvement over that based solely on ratings changes.

They also found that rating levels and rating changes forecasted future unexpected earnings, as well as the corresponding market reactions. This result implied that the predictive power of analysts’ recommendations was not simply a product of analysts’ ability to shift investor demand. Instead, it reflected their skill at collecting valuable private information about the future financial success of the firms they covered.

Value of $1 invested in recommendation-based strategies, January 1986 through December 2006. Reprinted from Barber, Lehavy, and Trueman (2010) with permission.

Value of $1 invested in recommendation-based strategies, January 1986 through December 2006. Reprinted from Barber, Lehavy, and Trueman (2010) with permission.

Trading strategy: Buy stocks with double upgrades. Sell stocks with double downgrades. Hold those long and short positions as long as the ratings remain intact. You can enhance this strategy by limiting recommendations to those made by analysts with the best track records.

Posted in Book One: Forty Trading Strategies Based On Scientific Findings About Analysts' Forecasts Tagged with: , , , , , , , , , , , , , , , , , , , , ,

When analysts have disagreed, how did markets behave?

Sadka and Scherbina (2007), of the University of Washington and Harvard University, examined returns of stocks with high levels of analyst disagreement about future earnings. Analysts’ earnings forecasts were taken from the Institutional Brokers Estimate System (I/B/E/S) U.S. Detail History and Summary History datasets. The latter contains summary statistics for analyst forecasts, including forecast mean, median, and standard deviation as well as information about the number of analysts making forecasts and the number of upward and downward revisions. These variables were calculated monthly. The data ran from 1983 through 2000.

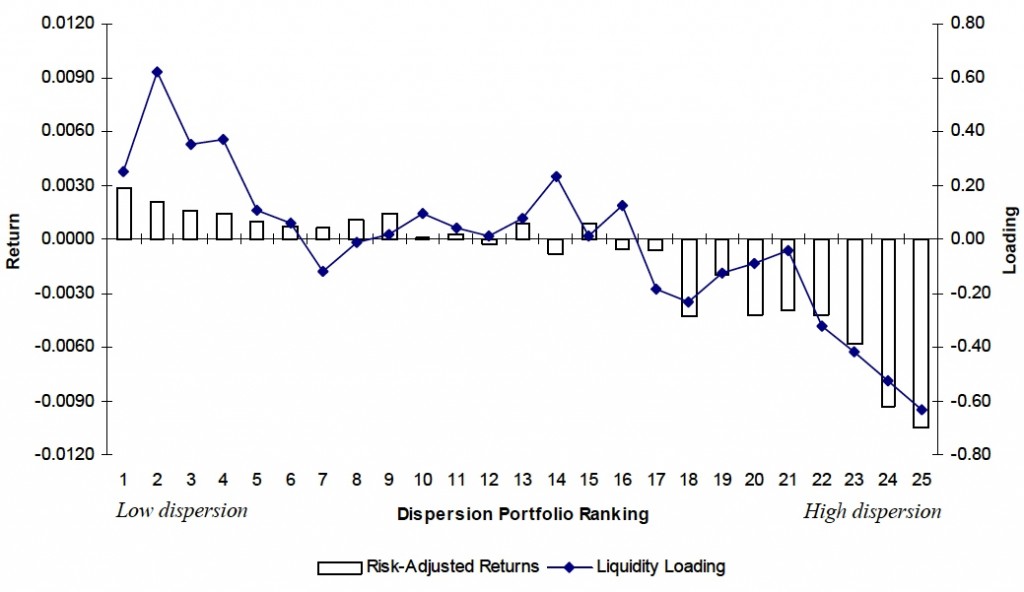
Their study revealed a close link between mispricing and liquidity. Previous research found these stocks often to be overpriced, but prices corrected down within a fiscal year as uncertainty about earnings was resolved. They conjectured that one reason mispricing had persisted was that these stocks had higher trading costs than otherwise similar stocks, possibly because some investors were better informed than the market maker about how to combine analysts’ opinions. The researchers theorized that analyst disagreement reduced the normal informational advantage of the marker makers. To compensate, market makers then behave in such a manner as to increase trading costs. In the cross-section of stocks examined in this study, less liquid stocks were more severely mispriced. Eventually, increases in market liquidity accelerated convergence of prices to fundamental values. As a result, returns of initially overpriced stocks then dropped.

At the beginning of each month stocks are sorted into 25 groups according to the dispersion in their analysts’ earnings forecasts available up to that month. Average monthly risk-adjusted returns are shown in the left column. Liquidity is shown on the right. When analysts disagree, stocks are clearly less liquid and offer lower returns. Reprinted from Sadka and Scherbina (2007) with permission.

At the beginning of each month stocks are sorted into 25 groups according to the dispersion in their analysts’ earnings forecasts available up to that month. Average monthly risk-adjusted returns are shown in the left column. Liquidity is shown on the right. When analysts disagree, stocks are clearly less liquid and offer lower returns. Reprinted from Sadka and Scherbina (2007) with permission.

Trading strategy: Avoid long positions in stocks where there is strong disagreement among analysts. When disagreement is very strong, consider shorting those stocks and holding the position for one month.

Posted in Book One: Forty Trading Strategies Based On Scientific Findings About Analysts' Forecasts Tagged with: , , , , , , , , , , , , , , , , , , , , ,

How have markets reacted when analysts initiated coverage of a stock?

This trading strategy has been excerpted from my new, Kindle eBook,The Alpha Interface: Empirical Research on the Predictability of Financial Markets. Book One: Forty Trading Strategies Based on Scientific Findings About Analysts’ Forecasts. As the title suggests, this is one of the forty strategies I present in the eBook.

The premise of the book is that the academic literature on financial markets contains much information that is useful for traders and investors. However, for the most part, the research is in inaccessible, obscure and difficult to read journals. I have attempted to present the best trading ideas from academia in a straightforward manner. Here is one of them:

Paul J. Irvine (2003), of Emory University, Atlanta, Georgia, compared stock returns surrounding a sell-side analyst’s initiation of coverage to the returns surrounding a recommendation by an analyst who already covers the stock. He drew upon data from the second and third quarters of 1995 that included a total of 2,128 analyst reports.

He found that the market responded more positively to analysts’ initiations than to other recommendations. In a company-matched sample, the incremental price impact of an initiation was 1.02% greater than the reaction to a recommendation by an analyst who already covered the stock.

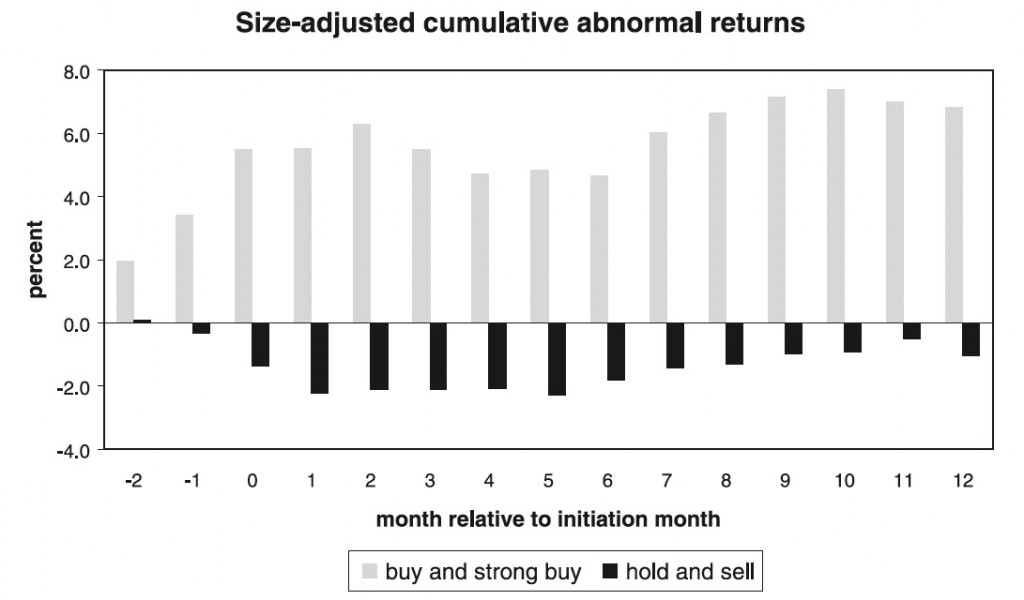
Long-term abnormal returns (i.e., alpha) around analyst initiations. Reprinted from Irvine (2003) with permission from Elsevier.

Long-term abnormal returns (i.e., alpha) around analyst initiations. Reprinted from Irvine (2003) with permission from Elsevier.

As the previous figure shows, the monthly alphas were significant in month (-2) and month (-1). This result is consistent with previous research that found analyst coverage tended to increase subsequent to positive price performance. The initiation month produced a significant positive abnormal return; but, after that month, stock prices showed no consistent pattern. Prices did not mean revert. This suggested that the price impact from an initiation was a permanent, positive event.

Initiation of analyst coverage with positive recommendations showed significant positive alpha beginning in month (-2) through the initiation month. In contract, initiation of coverage accompanied by negative recommendations was associated with insignificant abnormal returns. Positive initiations has permanent, positive effects; while negative initiations had minimal overall effect. This result was consistent with the hypothesis that the initial recommendation was related to a subsequent liquidity change.

Trading strategy: When an analyst initiates coverage of a stock with a buy recommendation, buy and hold for one month. When coverage is initiated with a hold or sell recommendation, sell and maintain the short position for one or two months.

Posted in Book One: Forty Trading Strategies Based On Scientific Findings About Analysts' Forecasts Tagged with: , , , , , , , , , , , , , , , , , , , ,

Analysts’ forecasts: Introduction to Book One

Book One Cover 03 rotate

This is the Introduction to Book One of The Alpha Interface series.

Each day in the United States and elsewhere, thousands of security analysts go to work at hundreds of different brokerage firms. They provide market analysis, write research reports and issue forecasts. According to the advisory firm Tabb Group (Johnson 2006), asset managers in the U.S. and U.K. spent $ 7.7 billion on internal and $ 7.1 billion on external research in 2006. This may seem like a great amount of money to spend on research, but consider that these firms are responsible for many trillions of dollars of assets under management. According to Maguire, et al. (2007), the asset management industry is responsible for a large amount of capital invested on behalf of its clients: globally, $53.4 trillion, almost 110% of world GDP, were under management in 2006, $24.3 trillion invested in equities. As the chart below shows, analyst activity has been on an uptrend.

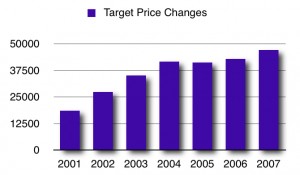
This chart shows the increasing number of analyst target price changes for US firms, obtained from the I/B/E/S database, from 2001-2007. This trend is also reflected in the increasing number of analysts and the increasing number of companies being covered by analysts. Chart based on data reported in Klobucnik, Kreutzmann, Sievers, and Kanne (2012).

This chart shows the increasing number of analyst target price changes for US firms, obtained from the I/B/E/S database, from 2001-2007. This trend is also reflected in the increasing number of analysts and the increasing number of companies being covered by analysts. Chart based on data reported in Klobucnik, Kreutzmann, Sievers, and Kanne (2012).

While sell-side analysts (i.e., those who work for brokerage firms and underwriters) have been researched with scrutiny by investors, regulators and academics, buy-side analysts (i.e., those who work internally, and thus privately, for various investment funds) have received far less attention.

Sell-side analysts through their forecasts attempt to predict and influence relative stock price movements in individual stocks and industries. They are also important contributors to the underwriting arm of their investment banks. They help investment bankers secure new business through their knowledge of the target firm’s industry and their reputation as key opinion leaders and valuation experts for the industry.

While, their efforts enhance the informational efficiency of financial markets, ironically this simultaneously diminishes the marginal value of their work. In a perfectly efficient market, analysts would not be able to add any value because market prices already would reflect any information analysts might have.

Information about analysts’ stock Forecasts generally is given first to important clients of a brokerage firm and only then released to the general public. During the period between the prerelease of information and the public announcement, these clients possess private information and, thus, can be viewed as informed traders. There are typically several hours during that informed clients can act on the analyst recommendation before the news is publicly released. Insofar as private information contained in analyst Forecasts had value, informed traders were able to earn a return on this information until the price of common shares fully incorporated the new information.

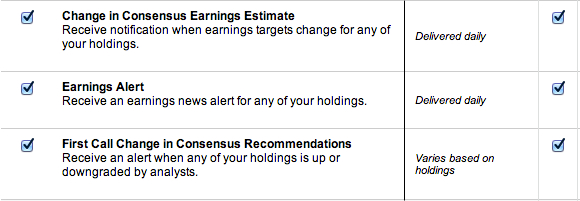
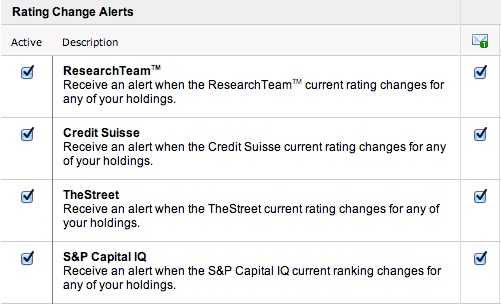
If you are new to trading and investing based on analyst recommendations, probably the best data resource for you will be your own online broker. Many online brokers now offer, at no extra cost, regular alerts when analyst recommendations or earnings estimates are revised. The following graphic shows the reports available through one online broker:

Alerts 03

Alerts 01

 Alerts 02

 After the internet bubble burst in 2000, investors grew increasingly suspicious of the value of U.S. sell-side, stock analyst Forecasts. With the investment banking business booming in the late 1990s and early 2000, there were media reports that these analysts were focused on attracting and retaining clients rather than on writing research reports that accurately reflected their opinions of the companies they were following. Furthermore, it became well known that analysts were behaving in an over-optimistic manner and traders needed to develop strategies to compensate for this.

On August 15, 2000, the SEC adopted Regulation Fair Disclosure (Reg FD) to address the selective disclosure of information by publicly traded companies and other issuers. Regulation FD provides that when an issuer discloses material nonpublic information to certain individuals or entities – generally, securities market professionals, such as stock analysts, or holders of the issuer’s securities who may well trade on the basis of the information – the issuer must make public disclosure of that information. In this way, the new rule aims to promote full and fair disclosure. The aim of this regulation has been to eliminate any unfair advantage offered by companies to some investors and analysts but not to others. Research, below, shows that Reg FD has been largely, but not entirely, successful in changing the investment environment.

There are many questions that researchers have explored regarding the process by that analysts evaluate the market, make forecasts and recommendations. And, of course, there are many more questions concerning how the market then reacts to the analysts’ output. In selecting research to report in this book, I have been guided by one principle: Is there a viable trading strategy that can be found here?

———————————————————————–

Klobucnik, J., Kreutzmann, D., Sievers, S., & Kanne, S. (2012). To buy or not to buy? The value of contradictory analyst signals.

Maguire, A., Morel, P., Kurstjens, H., Spellacy, M., Donnadieu, H., & Ortelli, M. (2007). The growth dilemma. global asset management 2007. The Boston Consulting Group.

Posted in Book One: Forty Trading Strategies Based On Scientific Findings About Analysts' Forecasts Tagged with: , , , , , , , , , , , , , , , , , , , , , , ,

Book Three: Trading With The News

Learn about a news-based trading system that yielded a back-tested, average annualized, compounded return from 2000 to 2011 of 58.6%.

“Only once you’ve done your homework will you be able to understand how the stock market works and learn to distinguish between news and noise.” Maria Bartiromo, Use The News

Book Two: Technical Analysis

Learn about the "trend recalling" algorithm that yielded researchers a simulated annual return of greater than 400% in multiple tests.

“The scientific method is the only rational way to extract useful knowledge from market data and the only rational approach for determining which technical analysis methods have predictive power.”
David Aronson, Evidence Based Technical Analysis

Book One: Analysts’ Forecasts

Learn the strategy, based on analysts' revised forecasts, that yielded researchers an average of 1.13% - 2.19% profit per trade, for trades lasting one to two days?

Learn how certain analysts' recommendations, following brokerage hosted investment conferences, yielded profits of over 3% during a two-day holding period?

Learn how researchers found an average profitability of 1.78% for two-hour trades following an earnings announcement?

"This set of tools can help both ordinary and professional investors alike to re-think and re-vitalize their stock picking, timing and methods. A young, aspiring Warren Buffet could put this book to good use."
James P. Driscoll, PhD, investor

Statistically Sound Machine Learning for Algorithmic Trading of Financial Instruments by David Aronson (software included)

Evidence-Based Technical Analysis by David Aronson

Archive of Earlier Posts