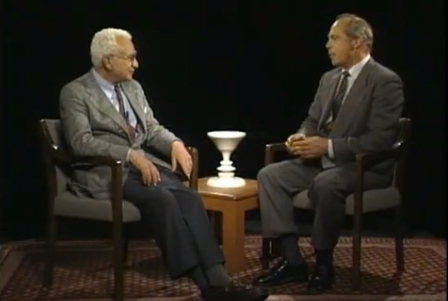
This excerpt from my Thinking Allowed interview with Nobel laureate Murray Gell-Mann addresses the human condition (and that of traders and investors) as complex adaptive systems facing fundamental quantum uncertainty in our macro-environment. Gell-Mann is the cofounder of The Santa Fe Institute. He is credited with the discovery of the Quark. He is author of The Quark and the Jaguar.
Complex adaptive systems facing fundamental uncertainty
The challenge facing artificial intelligence
John McCarthy (1927-2011) is considered by many to be one of the fathers of the field of artificial intelligence. He was the creator of the LISP programming language; and founder of the artificial intelligence laboratory at Stanford University. In this Thinking Allowed interview, I conducted with McCarthy back in the 1990s, he describes the challenges that he sees facing the field of artificial intelligence.
Knowledge engineering and expert systems in the financial markets
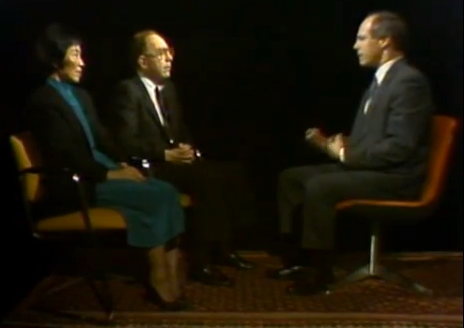
Between 1986 and 2002, I hosted the weekly television series, Thinking Allowed, interviewing leading figures about psychology, philosophy, science, health, and spirituality. In the interview that is excerpted below, I interviewed Edward Feigenbaum and his colleague Penny Nii. Feigenbaum was widely regarded as the father of the field of knowledge engineering. These interviews were generally done before I began to take a serious interest in the financial markets. So, I did not pay much attention then to the fact that Feigenbaum had attempted, with minimal success, to implement a knowledge engineering version of Robert Prechter’s interpretation of Elliott Wave Theory.
As I think about it, it seems reasonable to me that it should be possible to create knowledge engineered, expert systems based on outstanding traders (such as Rob Hoffman’s whose work I cited in my recent December 18 blog post). But, I do not know the extent to which this approach has ever been attempted or implemented.
The January effect: A predictable, seasonal market pattern
Over the past hundred years, a large body of economics and finance literature has documented monthly seasonality of returns on various assets, such as stocks, bonds, futures, currencies and commodities. More than 150 scientific journal articles, using a variety of data, methods, and time periods, in different markets, have supported the existence of cyclical anomalies.
A major reason why economists are interested in studying seasonal variations is that they are relatively exogenous factors, and hence studying them can help us better understand how markets work. The findings present a potentially serious challenge to classical models of market equilibrium and have stimulated the development of new theories that can account for them.
In recent years there has been a proliferation of empirical studies documenting unexpected or anomalous regularities in security rates of return. These include seasonal regularities related to the time of the day, the day of the week, the time of the month and the turn of the year.
Stock market returns are lowest on average during the fall months when the number of hours of daylight is falling toward its annual minimum. Mean stock returns are then highest as daylight becomes more plentiful in the new year. Numerous researchers report that stocks and bonds of small firms have extremely high January returns, especially during the first five trading days.
A new and interesting strand of research has evolved that investigates the possible impact of weather variables on investor behavior: a strong relation between cloud cover and stock returns, lower stock returns after weekends with daylight savings time changes, lunar phases, temperature.
Small and low priced stocks yield excess returns in the month of January, especially during the first five days. Unusually high returns also occur on the last trading day of December. The turn-of-the-year effect can be interpreted as evidence of a shift in the demand and supply for stocks occurring around the turn of the year. The most widely discussed reason for turn-of-the-year effect in the U.S. is year-end tax selling. Several authors document that the stocks that dropped most in the previous year rebounded most in early January. (Miller, 1990).
Lakonishok and Smidt (1988), from the University of Illinois and Cornell University, examine the potential profits from 1970 to 1981 obtainable by someone who bought the entire volume of stocks traded on the next-to-last day of the year with at least two transactions that day and sold on or after the fifth trading day of January for the stocks in the smallest decile (by trading volume, a criterion closely related to market capitalization) of all stocks on the New York Stock Exchange (NYSE) and the American Stock Exchange (ASE). The calculated return potential was 16.4 percent. This is not an annual rate of return, but a percentage return over about a week.
As one would expect, after the “January effect” was widely publicized, subsequent studies showed that its robustness was declining. The strongest evidence for the effect now comes from smaller countries such as Austria, Denmark, Greece, Brazil, Ireland, Pakistan, Philippines, Hungary, Kuwait, Peru, Portugal, Tunisia, Venezuela, Belgium, and Cyprus.
Predicting financial markets using associative remote viewing
Earlier this year, the Journal of Parapsychology, published the results from a 13-year experiment conducted by Greg Kolodziejzyk, using a unique approach to the associative remote viewing (ARV) protocol which allows a single operator to conduct the full ARV process beginning to end. ARV is, essentially, a form of clairvoyant precognition (or extrasensory perception, ESP) designed specifically for use in the area of financial forecasting. It has a history going back to the 1970s. Many important research studies that preceded this one are cited in the article. Also here is a link to an audio interview with Greg Kolodziejzyk about his work.
A total of 5,677 ARV trials were conducted from May 11, 1998, to September 26, 2011. Of these, 52.65 % were correct in predicting the outcome of their respective future events (where only 50% would be expected by chance), yielding a statistically significant score of z = 4.0. These 5,677 trials addressed a total of 285 project questions. Most of these project questions were intended to predict the outcome of a given futures market. Of these project questions, 60.3% were answered correctly, resulting in a statistically significant z = 3.49. By increasing the number of trials in a project question, and giving more weight to higher subjective confidence scores reflecting the quality of the match between the remote viewing and one of the two target images, the success rate increased to above 70%. One hundred eighty-one project questions resulted in actual futures trades where capital was risked. Of these, 60% of the trades were profitable, amounting to approximately $146,587.30.
In the academic community, particularly in the field of psychology, there is a tendency to scoff as results such as this. The study of extrasensory perception is still considered by many to be a fringe science. However, it should be noted that the Parapsychological Association, the organization of serious researchers in this field, has had a formal association with the American Association for the Advancement of Science since 1969. I myself, received a doctoral degree in parapsychology back in 1980 from the University of California, Berkeley. And, in spite of the controversies that stigmatize this field, I can attest from decades of experience that, generally speaking, parapsychology researchers are far more sophisticated and knowledgeable than their noisy critics.
Progress in this field is very slow. But, eventually, I imagine that Kolodziejzyk’s pioneering work (and that of others in the field) will become incorporated into the realm of mainstream financial forecasting. My timetable for this is about fifty years; although, if I had my way, it would be sooner.
Reversion to the mean: An evergreen trading strategy
Although my posts on this website are almost exclusively related to published, academic research on the financial markets, I have also been a trader myself since 1999. Currently, I am studying daytrading methods with Rob Hoffman, of Become A Better Trader. Rob has twice won the Salon du Trading, an international trading competition in Paris, France, competing in public against fifteen other prominent traders. Rob’s ability to come out on top of this grueling competition two years in a row speaks a great deal about the usefulness of technical analysis in the markets. To the best of my knowledge, Rob’s expertise comes from a world that is almost totally independent of academic research, high frequency trading, machine learning, or financial engineering.
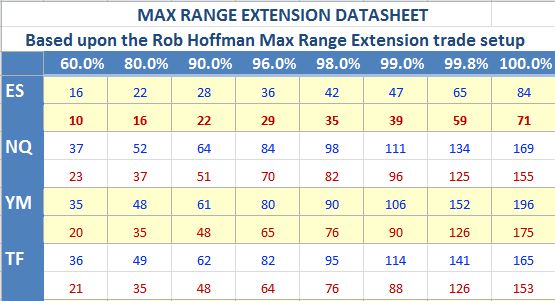
Today, I am particularly interested in one of Rob’s trade setups that involves the maximum range extension typical of hourly bars on futures contracts. The following data, based on the four major stock market index emini futures contracts, is illustrative (although the principle, I believe, should apply to any security whatsoever). ES represents the S&P 500 stocks. NQ represents the Nasdaq 100 index. YM represents the Dow Jones Industrial Average. TF is the futures contract for the Russell 2000 index of small cap stocks.
The chart shows the maximum range, in ticks (i.e., minimal trading increments), for one-hour bars. The percentage figures are actually percentiles that reflect the percentage of bars that are at or below the specified number of ticks. The blue numbers reflect the distance from the open to either the high or the low. The red numbers reflect the distance from the open to the close.
For example, eighty percent of the time, an hourly bar on the S&P 500 emini futures contract, will move 22 ticks (i.e., 5.5 points) or less from the open of the bar. Therefore, only 20% of the time, will an hour bar move more than 22 ticks. On the other hand, only 10% of the time will the close of an hourly bar be greater than 22 ticks. The most likely scenario for an hourly price bar that moves 22 ticks from the open is that it will close about 16 ticks from the open.
This type of statistic is highly repeatable, in every time frame, for every security. There is generally some distance between the maximum range of a price bar and where it eventually closes. And, especially for extremely wide-ranging price bars, there is a measureable tendency for prices to revert back to the mean. Many trading systems are predicated upon this principle.
I will not go into details regarding Rob Hoffman’s particular system. However, I can say that he does combine the maximum range extension principle with an appreciation of the trend direction, as well as support and resistance levels, and overbought/oversold indicators. Rob has asked his students not to publicly reveal any of his methods. However, I do feel that it is appropriate to post these general principles and acknowledge my appreciation for the hard-won knowledge of traders such as Rob Hoffman. I have come to appreciate the sense in which the intuitive knowledge of such traders, in its own unique way, goes well beyond that which is available in the academic literature.
Patterns in the 24 hour trading cycle
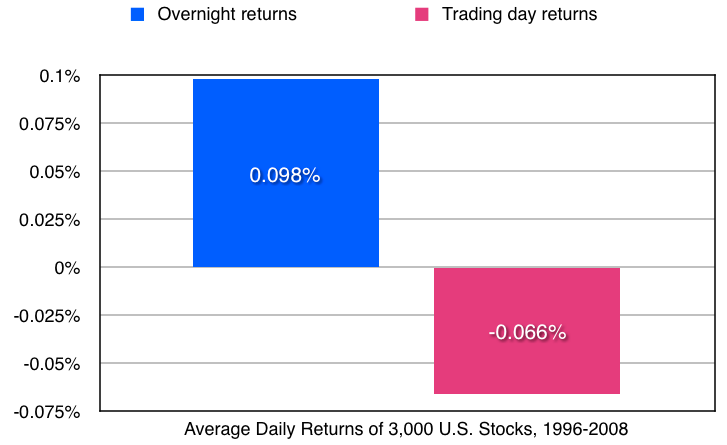
Berkman, Koch, Tuttle and Zhang (2012) – from the University of Auckland, New Zealand; the University of Kansas; the American University of Sharjah, United Arab Emirates; and Missouri State University – examined the intraday stock prices of the 3,000 largest U.S. firms from 1996 through 2008. They found a strong tendency for positive returns during the overnight period followed by reversals during the trading day. This behavior was driven initially by an opening price that was high relative to intraday prices. It was concentrated among stocks that had recently attracted the attention of retail investors (typically due to a news announcement), it was more pronounced for stocks that were difficult to value and costly to arbitrage, and it was greater during periods of high overall retail investor sentiment.
The high opening prices they found for stocks subject to high attention and low institutional ownership represented a substantial hidden cost of buying at the open. Their tests were predictive and thus indicated that postponing purchases of these stocks from the open until later in the day can avoid these hidden costs. Similarly, selling these stocks at the open, rather than later in the day, can lead to major improvements in performance. For example, a mean trading day reversal of 45 basis points (i.e., 0.45%) per day accumulates to 112.5% per annum.
They also found that this effect correlated with measure of investor sentiment. For example, mean overnight returns and trading day reversals were more than twice as large during months with high versus low sentiment. One of their sentiment measures was the Baker and Wurgler (2007) sentiment index. The other measure was based upon market-wide net buying activity by retail investors during the 1st hour of the trading day.
Profiting from changes to the Nasdaq 100 index
Yuanbin Xu (2012), writing his masters degree thesis at Brock University, in St. Catherines, Ontario, Canada, examined stock market reactions around the Nasdaq-100 index reconstitutions from 1997 to 2010.
The Nasdaq-100 index changes have been performed in two ways: regular index changes and irregular index changes. Regular annual index changes are primarily based on market capitalizations. The public announcement is usually released via a press release in early December and changes become effective after market close on the third Friday of December. The market capitalizations are calculated using the Nasdaq official closing price on the last trading day of October, and shares outstanding from a public SEC document available on EDGAR as of the end of November. Given that this data is generally accessible to all investors, regular index changes have been predictable.
In contrast, irregular index changes occur when securities no longer meet the eligibility criteria. Neither the specific time nor the reasons are publicly known until they are released, so irregular index changes have usually been unpredictable.
In Xu’s sample included 205 additions and 136 deletions from the index. 136 additions and deletions were regular while 69 additions were irregular. Nearly all of the irregular deletions were involved in confounding events and therefore were not included in the sample studied.
For the regular additions, Xu found a significantly positive, abnormal return of 0.76% on the announcement day. The cumulative abnormal return from the first day in December to the day before the announcement day averaged 3.66%. This was also statistically significant. However, he also found that prices reversed completely, on average, by the effective date of the third Friday in December. The results were mixed for regular deletions from the index.
On average, the irregular additions to the index experienced an abnormal return of 1.28% on the announcement date and 1.73% on the following day. And, another gain of 1% occurred on the effective day. The price reversal started the day after the effective date, and that was a significantly negative 1.37%.
In summary, Xu noted, individual investors could could profit by purchasing stocks added to the Nasdaq-100 index, and shorting stocks deleted from the index, on the announcement date, and then closing the position on or before the effective date.
Interview in Foresight: The International Journal of Applied Forecasting
“Forecaster in the Field” Interview with Jeffrey Mishlove, author of The Alpha Interface series.
How did you get started in financial forecasting? In the mid-1990s, I was serving as president of an organization called the Intuition Network (the logo that I designed is shown below) that was dedicated to helping people cultivate and apply their intuitive abilities. A number of our members were active in the financial markets, and several were eager to instruct me in their approaches. Before long, I complemented the intuitive approach with a study of technical analysis and neural networks. The results proved to be surprisingly successful in a short period of time.
How did you come to create The Alpha Interface book series? One day, my wife, Janelle Barlow, came to me and said, “I have a billion-dollar idea for you.” In the course of our conversation, I realized that there was a huge body of recent, empirical research about the operation of the financial markets. Old theories concerning the random walk and the “efficient market” were being challenged on multiple fronts. Ironically, most traders, investors, and even economists were unaware of the full scope of this research. The financial forecasting landscape is changing rapidly. Because I have the ability to digest a large volume of information and make it understandable to the general public, I took this project on. Three books have now been released.
What other forms of forecasting have been important in your development? As a doctoral student at UC Berkeley with an interdisciplinary program in parapsychology, I became familiar with the research literature in such areas as precognition and remote viewing. Although I began as a skeptic in my inquiry into these topics, after carefully studying the evidence that’s accumulated for more than a century,I became convinced that this is an important field. Some outstanding scientists have contributed to this area of study. My first book, The Roots of Consciousness (1975), dealt extensively with these phenomena. I also had the privilege of hosting the national public-TV series Thinking Allowed over a 15-year period. During that time, I conducted intimate interviews with thought leaders in philosophy, psychology, health, science, and spirituality. Each of my guests in their own way was attempting to forecast – and to influence – the future of humanity. A number of them were professional forecasters. Their influence rubbed off on me. So it’s fair to say my approach is interdisciplinary.
Do you work with businesses to improve their forecasting accuracy? As scientific as business forecasting can be, there’s always a human element. My wife Janelle and I own the licenses in the United States for TMI and TACK, two international training and consulting consortiums. These businesses work with organizations to optimize the full potential of their systems and staff. We like to say that TACK is about getting customers, and TMI is about keeping them. Our clients are typically, but not always, multinational companies. Missed forecasts often occur when different branches of a business are not aligned with each other, nor with the brands they represent. We help them to identify and then correct these gaps in their organizational alignment and in the collective skill sets of their staffs.
Tell us about your other interests. In 2010, two friends and I discovered the first confirmed dinosaur footprints found in the state of Nevada. They were just a few miles from my home in Las Vegas, in the nearby Red Rock Canyon National Conservation Area.
Information dissipation as an early warning signal
The theoretical underpinnings of bifurcations and phase transitions in finance have been around for many years. In the 1970s, the mathematical framework of catastrophe theory became a popular field of research, as it provided one of the first formalizations that included notions both of equilibrium and nonlinear-state transitions. This formalism resulted in parsimonious descriptions of bull and bear markets and market crash dynamics. It employed a small number of parameters such as the relative proportion of technical traders (those who base their strategies on historical prices) and fundamentalists (those who base their strategies on the underlying business dynamics).
Since 1999, many researchers have argued that financial bubbles and crashes exhibit unique mathematical signatures known as log-periodic oscillations. This refers to a sequence of oscillations with progressively shorter cycles of a period decaying according to a geometrical series. The pattern has been documented in unrelated crashes from 1929 to 1998, on stock markets and currencies as diverse as those in the U.S., Hong Kong, and Russia, as well as for oil and even real estate. Recent refinements indicate that this approach is becoming increasingly sophisticated (Filimonov and Sornette, 2013), and with the onset of massive databases and high-performance computing, it has become possible to empirically study the more granular dynamics of the relationships between securities.
Researchers are coming to understand these processes with ever greater mathematical sophistication. As one example of several recently published, Quax and colleagues (2013) from the University of Amsterdam in the Netherlands have measured this self-organized correlation in terms of the transmission of information among units. They recently introduced the information dissipation length (IDL) as a measure of the characteristic distance of the decay of mutual information in the system. As such, it can be used to detect the onset of long-range correlations in the system that precede critical transitions.
The higher the IDL of a system, the largerthe distance over which a unit can influence other units, and the better the units are capable of a collective transition to a different state. Because of this, they can measure the IDL of systems of coupled units and detect their propensity to a catastrophic change. As a demonstration of the IDL as a leading indicator of global instability of dynamical systems, they measured the IDL of risk trading among banks by calculating the IDL of the returns of interest-rate swaps (IRS) across maturities.

