
The opposite was true for low-volume stocks. When past week returns were negative, a drop in volume led to a continuation of negative returns. When the past week’s returns were positive, a drop in volume led to a reversal in returns. In both instances, a drop in volume was associated with a drop in prices. This is in accord with much trading lore.
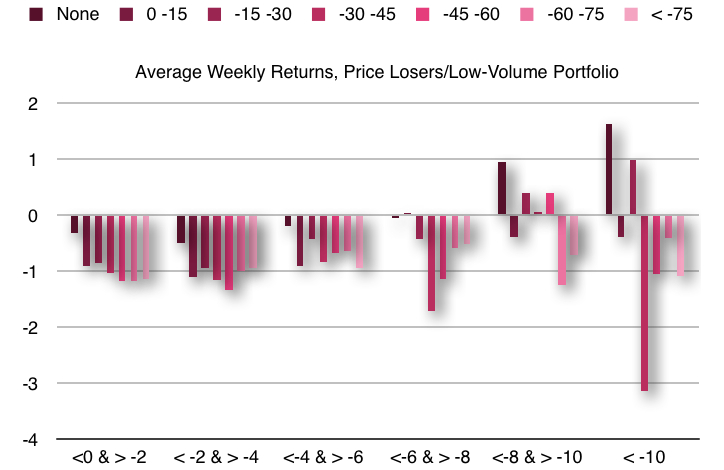
The chart above shows the momentum continuation effect for stocks with low volume that were price-losers during the prior week. The horizontal axis groups stocks according to the percentage loss during the previous week. The colors show the degree of the percentage increase in volume. The vertical axis shows the percentage gain or loss. Based on data from Alsubaie and Najand (2009).
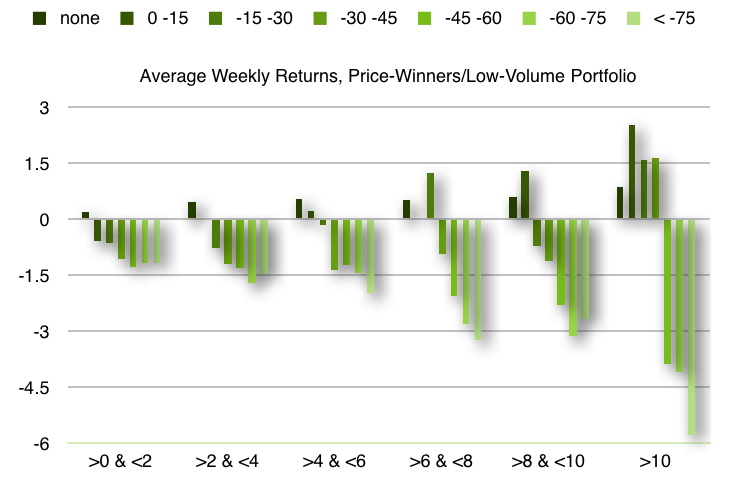
The chart above shows the reversal effect for stocks with a drop in volume that were price-winners during the prior week. The horizontal axis groups stocks according to the percentage gain during the previous week. The colors show the degree of the percentage decrease in volume. The vertical axis shows the percentage gain or loss. Based on data from Alsubaie and Najand (2009).
One must be mindful, that these results were generated from a unique bull market phase within an emerging market. Nevertheless, the lore generated by traders who focus on volume (i.e., see Leibovit, 2011) in other markets largely agrees with the pattern documented in Saudi Arabia.
Trading strategy: In a bull market, buy stocks that have dropped sharply in price the previous week on high volume. Hold for one week. In a bull market, buy stocks that have risen strongly in price the previous week on high volume. Hold short positions for one week. Sell stocks that have risen sharply the previous week on decreasing volume. Hold short positions for one week.